
Monitoring is an essential part of any modern application, especially in the cloud. In the Azure ecosystem, developers and IT teams commonly use Application Insights and Log Analytics Workspaces to gain full observability into app behavior, performance, and reliability. This blog post explains how these tools work together to enable powerful monitoring, diagnostics, and alerting.
💡 What are Application Insights?
Application Insights is an Application Performance Management (APM) tool under the Azure Monitor toolset. It provides deep insights into how an application runs, helping teams detect failures, monitor performance, and troubleshoot issues.
Azure monitor toolset:
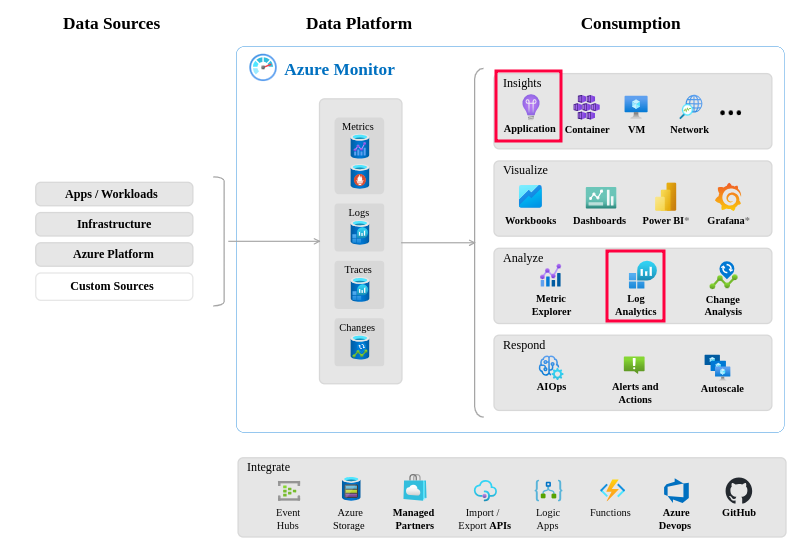
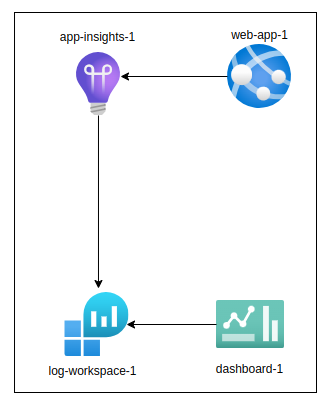
Application Insights store its logs in Log Analytics workspace, and the two resources are automatically linked. Log Analytics workspace primarily handles data storage, while Application Insights provides various ways to visualize and analyze data.
Logic model of Application Insights:
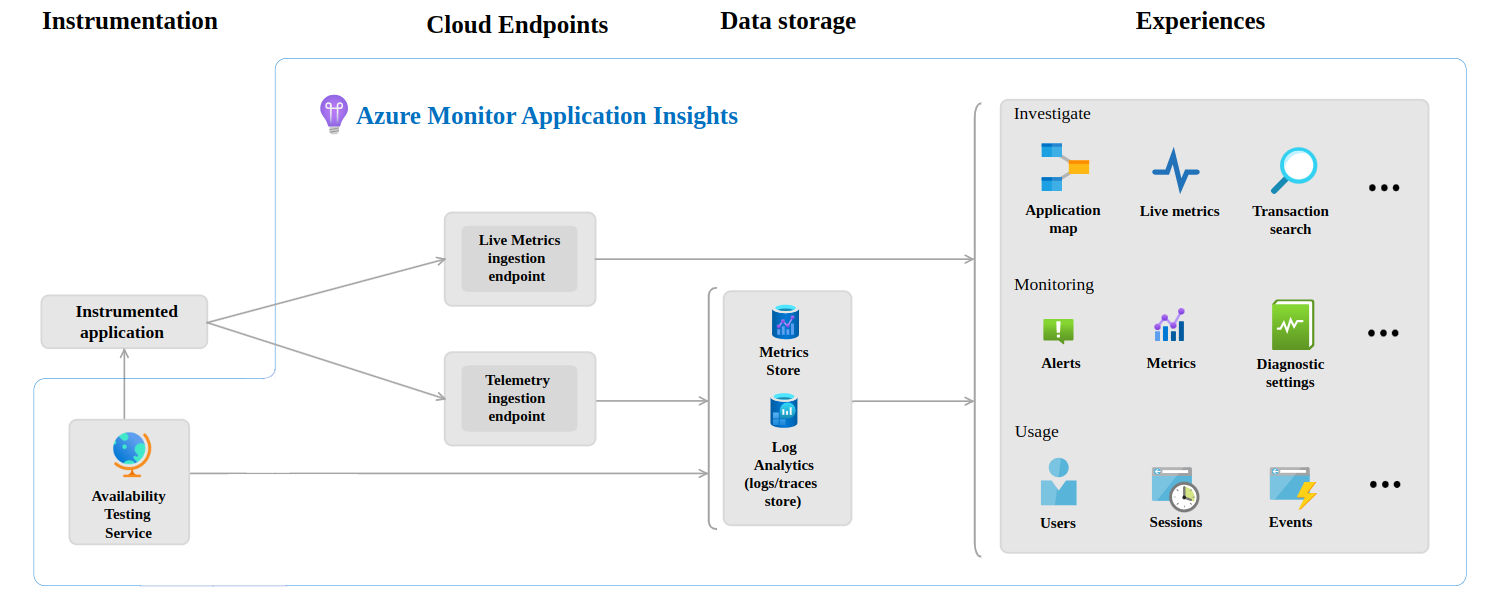
There is always a 1:1 mapping when it comes to Application Insights and Log Analytics workspace. Although you can use multiple Application Insights instances using the same Log Analytics workspace, only the one linked to the application will contain the data.
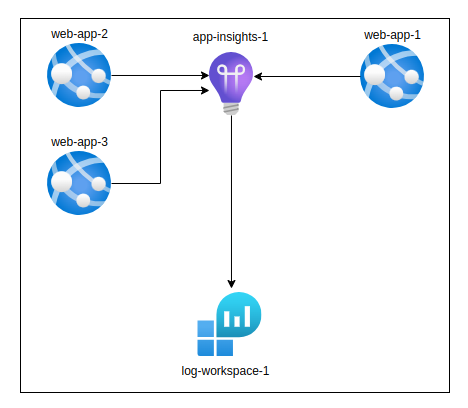
However you can have one Application Insights collecting logs from various applications. It might make sense in certain scenarios, but best practice is to have one Application Insights per one web app (or Function App).
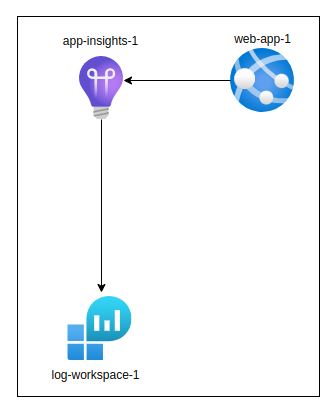
Mapping of Web Application (or Function App) to the application insights:
Mapping of multiple web applications to one Application Insights:
When managing multiple Application Insights instances, it is a best practice to use as few Log Analytics Workspaces as possible. Generally speaking, you want to reduce your resources and your overall architecture as much as possible to avoid complexity of managing it. By doing so, you can effectively centralize your data in one location and also configure data retention, RBAC and other features in one place. However, there are also scenarios when you might need to use more than one logs analytic workspace, depending on your business requirements.
Log Analytics Workspace is also being used by other Azure Monitor tools, such as Microsoft Sentinel and Microsoft Defender for Cloud.
Out of the box, Application Insights can collect:
- Request rates, response times, and failure rates
- Server exceptions and dependency failures
- Performance counters (CPU, memory, etc.)
- Custom events and metrics
- Live telemetry (for real-time debugging)
…. and much more. To view all features visit the Microsoft documentation.
Application Insights works well with various platforms including .NET, Node.js, Python, and Java. It can be enabled through the Azure Portal or integrated via SDK.
🏗️ Common architecture setup
A typical setup for Azure app monitoring includes the following:
- App Service / Function App
↳ Sends telemetry to - Application Insights
↳ Connected to - Log Analytics Workspace
↳ Queried using - Azure Monitor Dashboards & Alerts
This architecture centralizes both application and infrastructure data for full-stack monitoring.
⚙️ How to configure it
Enable Application Insights using autoinstrumentation
Autoinstrumentation is process of adding instrumentation code to applications without manually coding by developers. Azure provides this autoinstrumentation for Application Services as well as Azure Functions. However, it does not work for all language and environments:
| Environment | .NET Framework | .NET Core / .NET | Java | Node.js | Python |
|---|---|---|---|---|---|
| Azure App Service (Windows – Code) | ✅ | ✅ | ✅ | ✅ | ❌ |
| Azure App Service (Windows – Container) | ✅ | ✅ | ✅ | ✅ | ❌ |
| Azure App Service (Linux – Code) | ❌ | ✅ | ✅ | ✅ | ✅ |
| Azure App Service (Linux – Container) | ❌ | ✅ | ✅ | ✅ | ❌ |
| Azure Functions (Basic monitoring) | ✅ | ✅ | ❌ | ✅ | ✅ |
| Azure Functions (With dependency tracking) | ❌ | ❌ | ❌ | ❌ | ❌ |
For full list including other resources including AKS and VMs, visit the Microsoft documentation.
Now I will walk you through enabling Application Insights using both Azure Portal as well as Azure CLI. The process of creating and deploying basic web app using previously mentioned frameworks is available at this link. For this tutorial, I assume you already deployed your application.
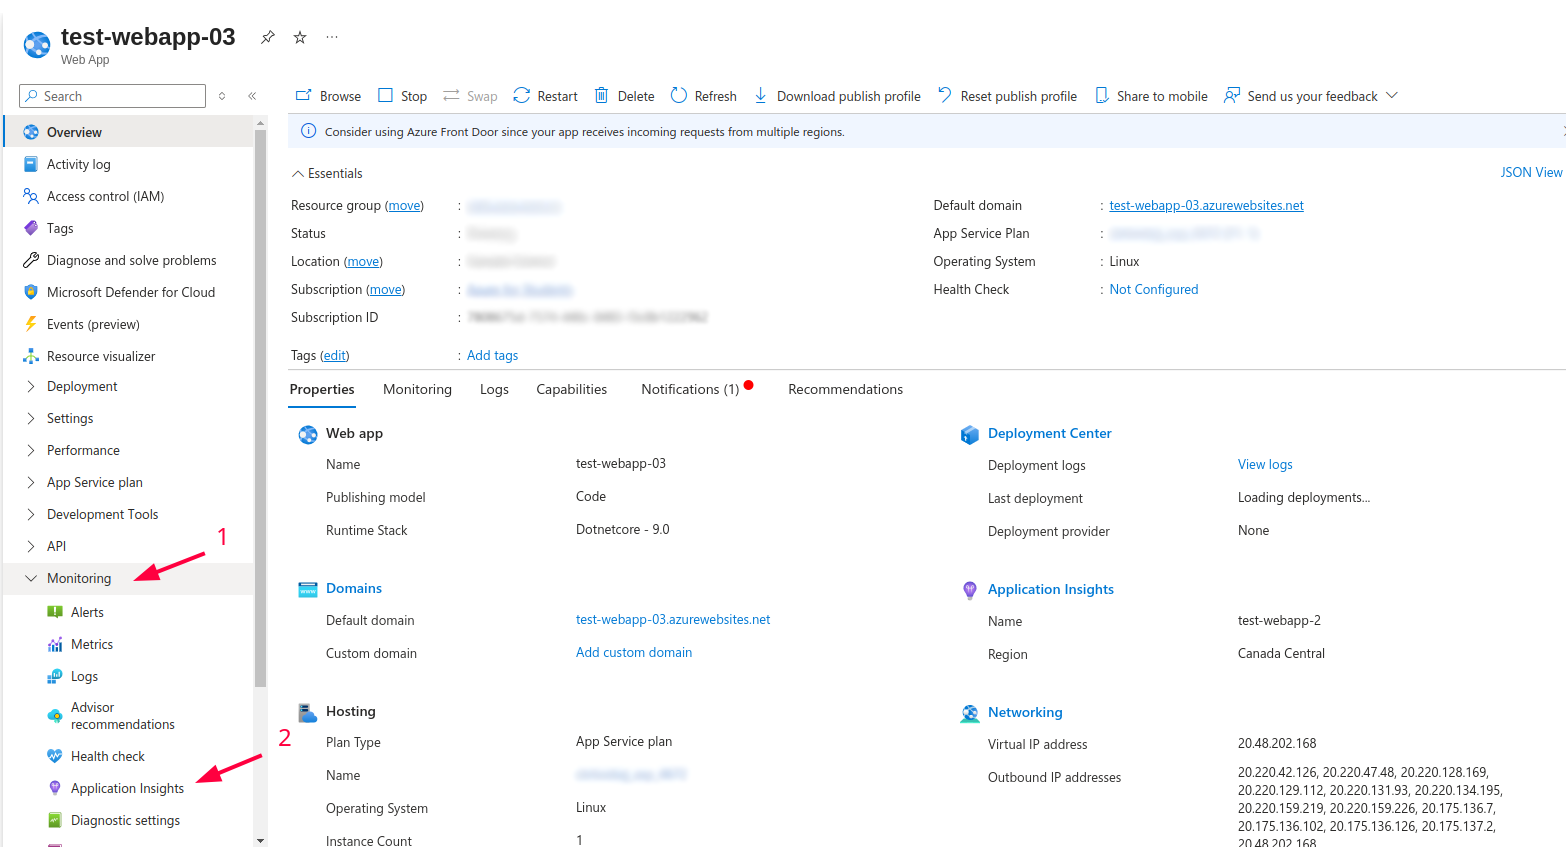
- Go to your Web App using portal -> Monitoring -> Application Insights
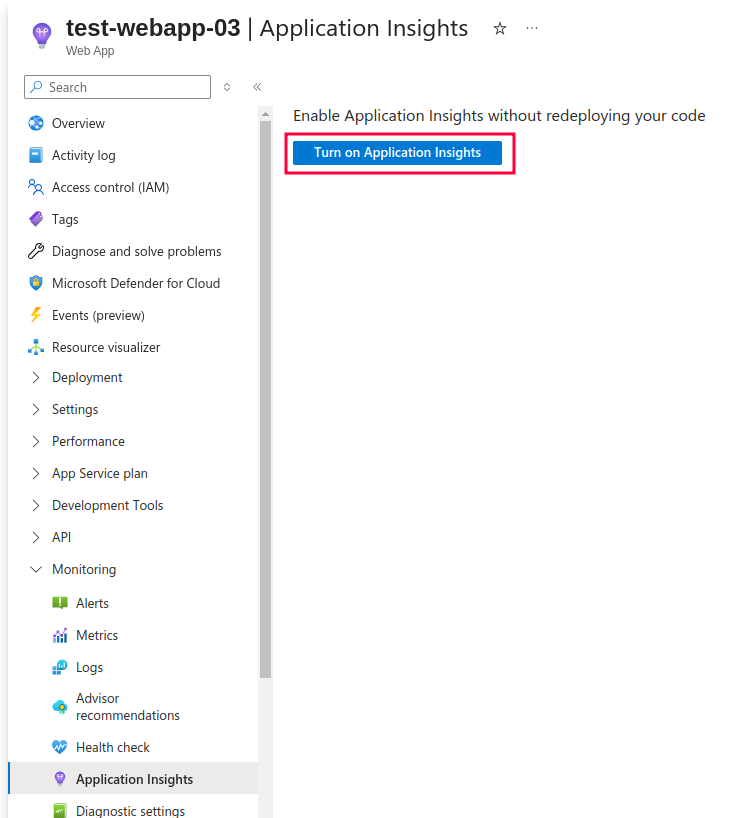
- Click on ‘Turn on Application Insights’
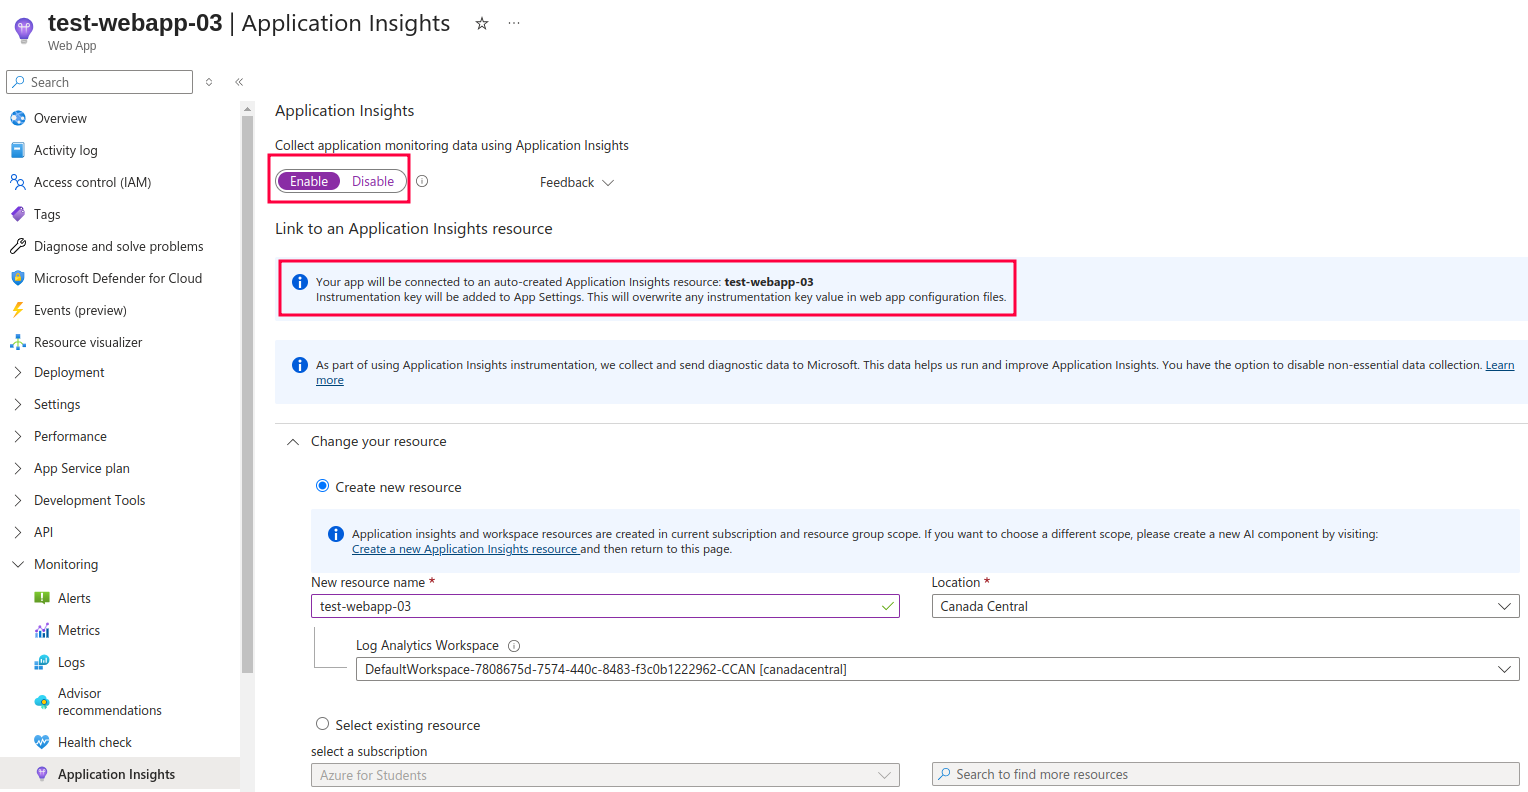
After that, you are presented with various details related to your Application Insights settings. As highlighted in the picture below, you should click on ‘Enable’ button before proceeding. You are also informed about new Applications Insights resource which will be created. In this example, it is called test-webapp-03. However, you are free to change its name in Change your resource section below.
You can either create a new Application Insights resource, or you can use existing one. For the purpose of this tutorial, I will create a new resource. Alongside resource name, you can also choose the Location as well as Log Analytics Workspace. If you do not currently have log analytics workspace in the given location it will be automatically created for you, so you do not have to do it separately. It will appear just as shown in the image below, but with the ‘(new)’ label next to it, indicating that it is about to be created:
- Choose the underlying framework of your app
In my case, the underlying framework is .NET core:
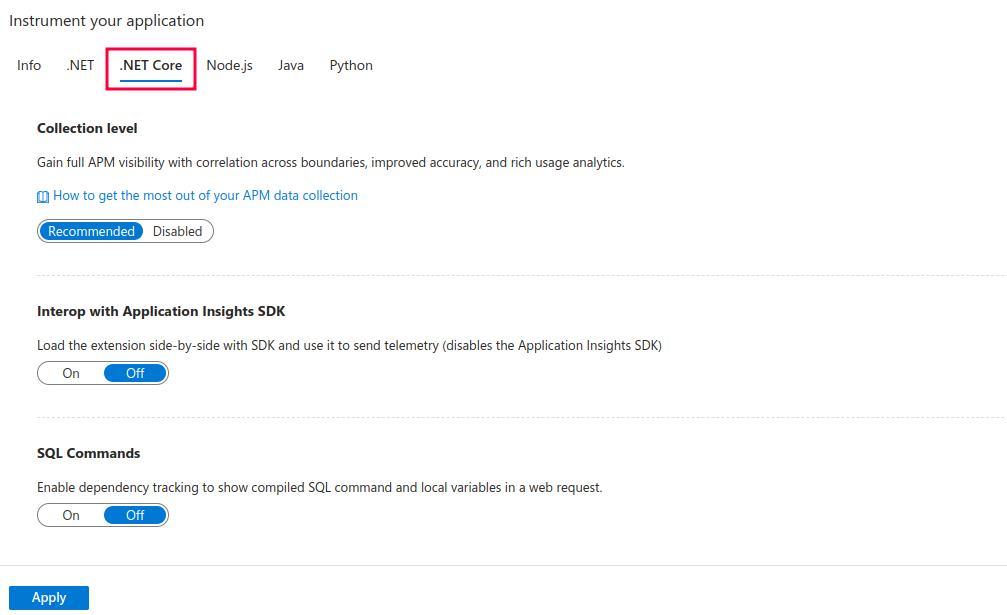
Explanation of options shown above:
- Collection level – set to Recommended. This option essentially enables server-side monitoring:
| Data | Recommended | Basic |
|---|---|---|
| Adds CPU, memory, and I/O usage trends | Yes | No |
| Collects usage trends, and enables correlation from availability results to transactions | Yes | Yes |
| Collects exceptions unhandled by the host process | Yes | Yes |
| Improves APM metrics accuracy under load, when sampling is used | Yes | Yes |
| Correlates micro-services across request/dependency boundaries | Yes | No (single-instance APM capabilities only) |
As shown in the table, the Recommended option provides more information and therefore I also used this option. To learn more about APM monitoring visit this link.
- Interop with Application Insights SDK – until now I wrote mainly about using Application Insights with codeless approach. However, you can also use various SDKs in the code itself, such as Microsoft.ApplicationInsights or Microsoft.ApplicationInsights.AspNetCore to send the telemetry to Application Insights. When this option is set to ‘On’, the telemetry sent from your code is discarded. This might be useful if you already have the telemetry code in your application, but you do not want to delete it (maybe later you might switch to using it again, or for other reasons).
- SQL Commands – that is self-explanatory. Enable this if you want to keep track of the compiled SQL commands as well as local variables in web requests.
- Finally click on Apply button
After you click on apply, the Application Insights for Web Application are automatically created and set up. You can also check the status by visiting a URL in the following format:
https://<app-name>.scm.azurewebsites.net/ApplicationInsights.
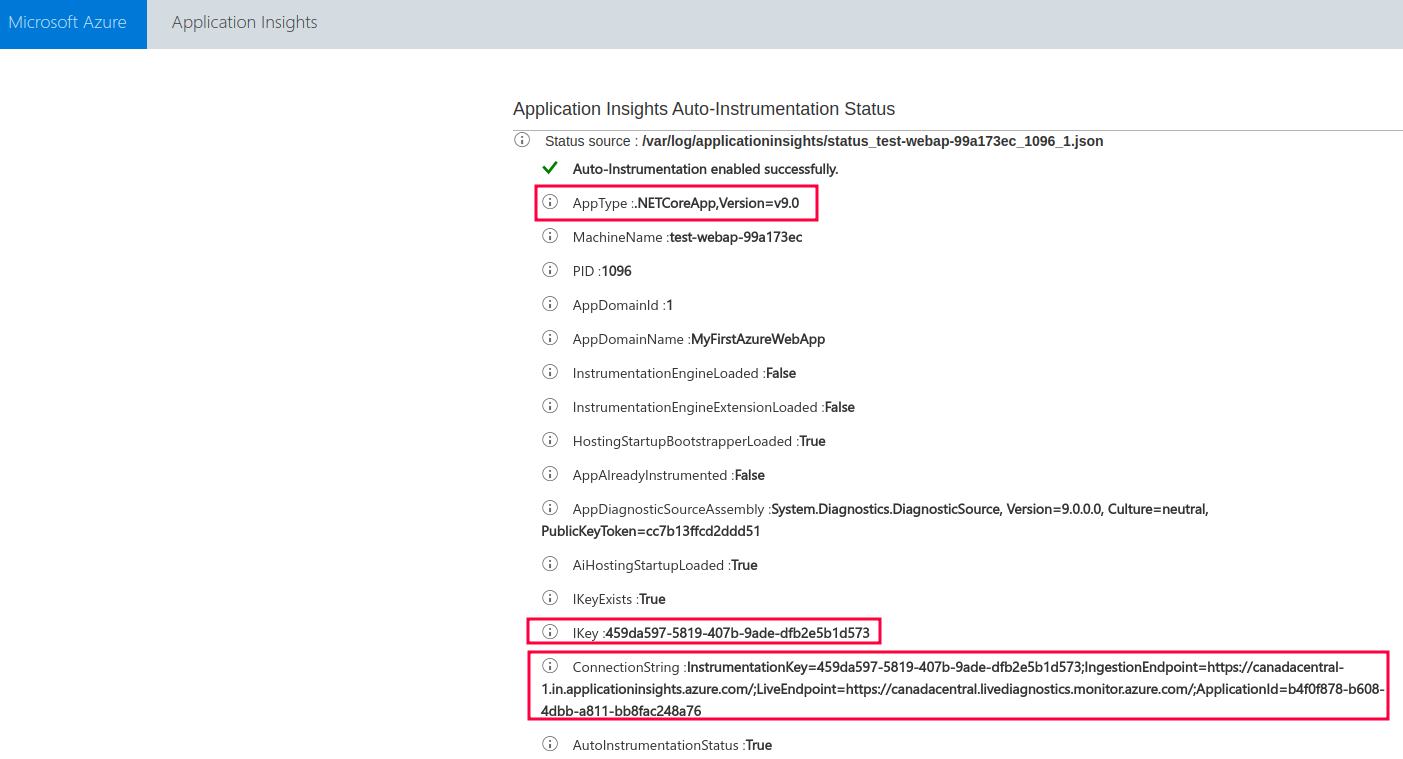
As shown in the picture above, the url contains various details with regards to your app (such as its type) and to the connected Application Insights (such as instrumentation key or connection string).
Sampling
You can also configure application sampling for your app. Sampling helps you avoid Application Insights throttling your telemetry. It is a recommended way to reduce telemetry traffic, data costs and storage costs while preserving a statistically correct analysis of application data. Generally speaking, you do not need to apply sampling for small to medium sized applications. Visit Microsoft documentation to learn more about sampling. Sampling is however configured in code itself and in json configuration file as well (in case of .NET applications).
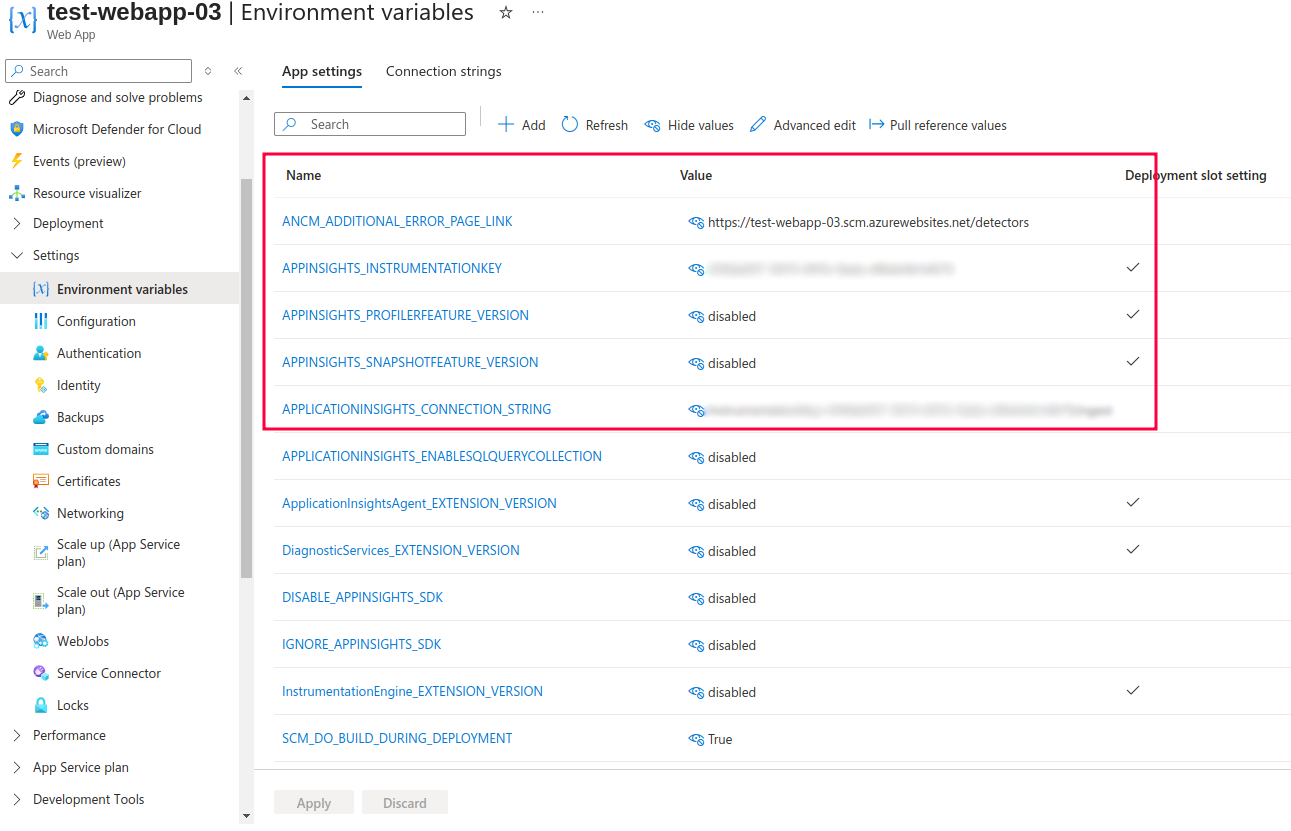
Environment variables – app settings
Many of the previously selected options are translated to environment variables of the app service. You can change the settings in here as well – however, variables here are not only related to application settings. To learn more about environment variables related to Application Insights visit this link.
⚡ Live metrics
Live Metrics provides near real-time telemetry for monitored applications. Developers and ops teams can see incoming requests, response times, failure rates, and server health instantly — without needing to wait for logs to aggregate. This is particularly useful during deployments or incident investigations to verify whether changes are behaving as expected.
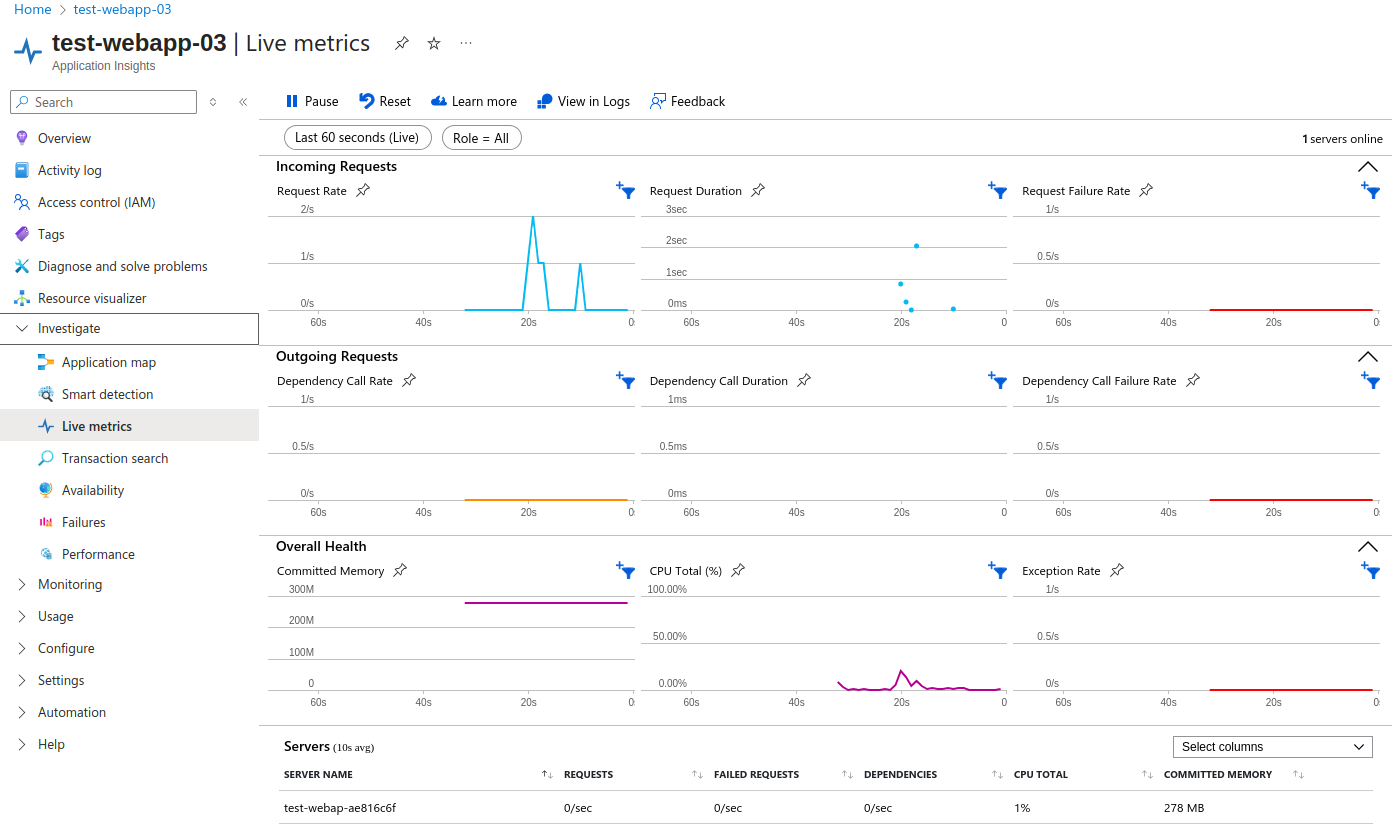
At the bottom of the screen, you’ll see a list of servers monitored by Application Insights. In this case, only my web application is listed.
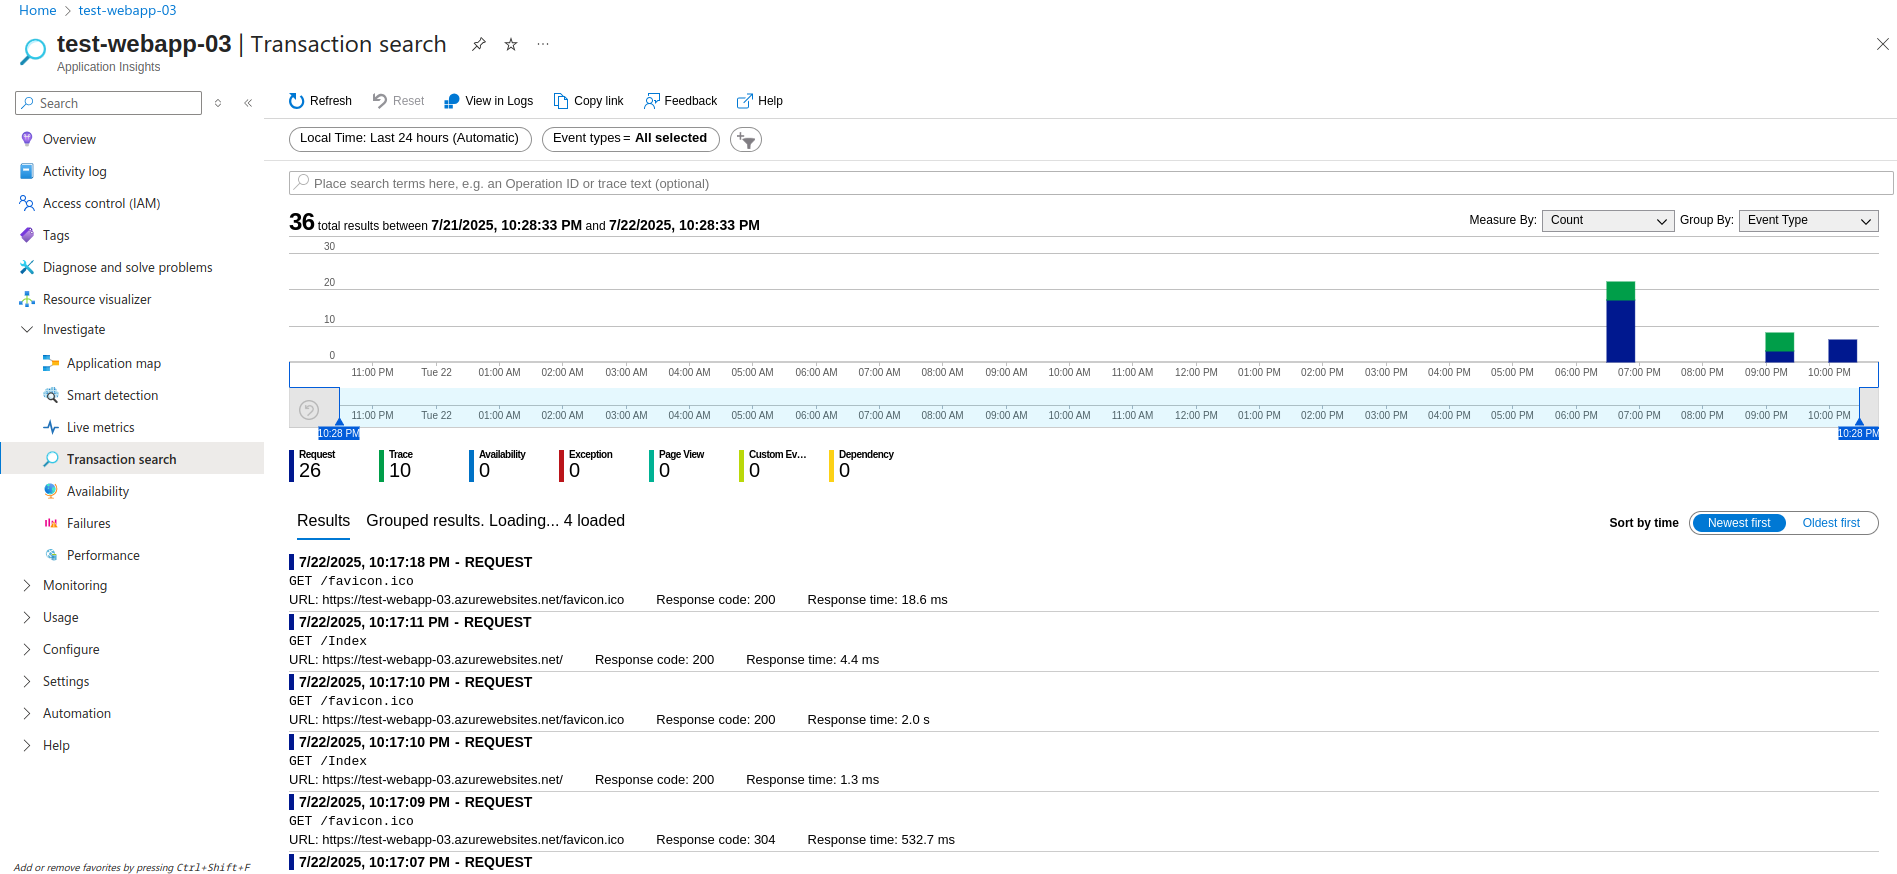
🔎 Transaction search
Transaction Search allows engineers to dig deep into specific events such as requests, traces, exceptions, and custom telemetry. It’s ideal for reconstructing detailed user interactions, identifying root causes of failures, and understanding performance bottlenecks. Each transaction provides full correlation with dependency calls and logs, enabling full end-to-end visibility:
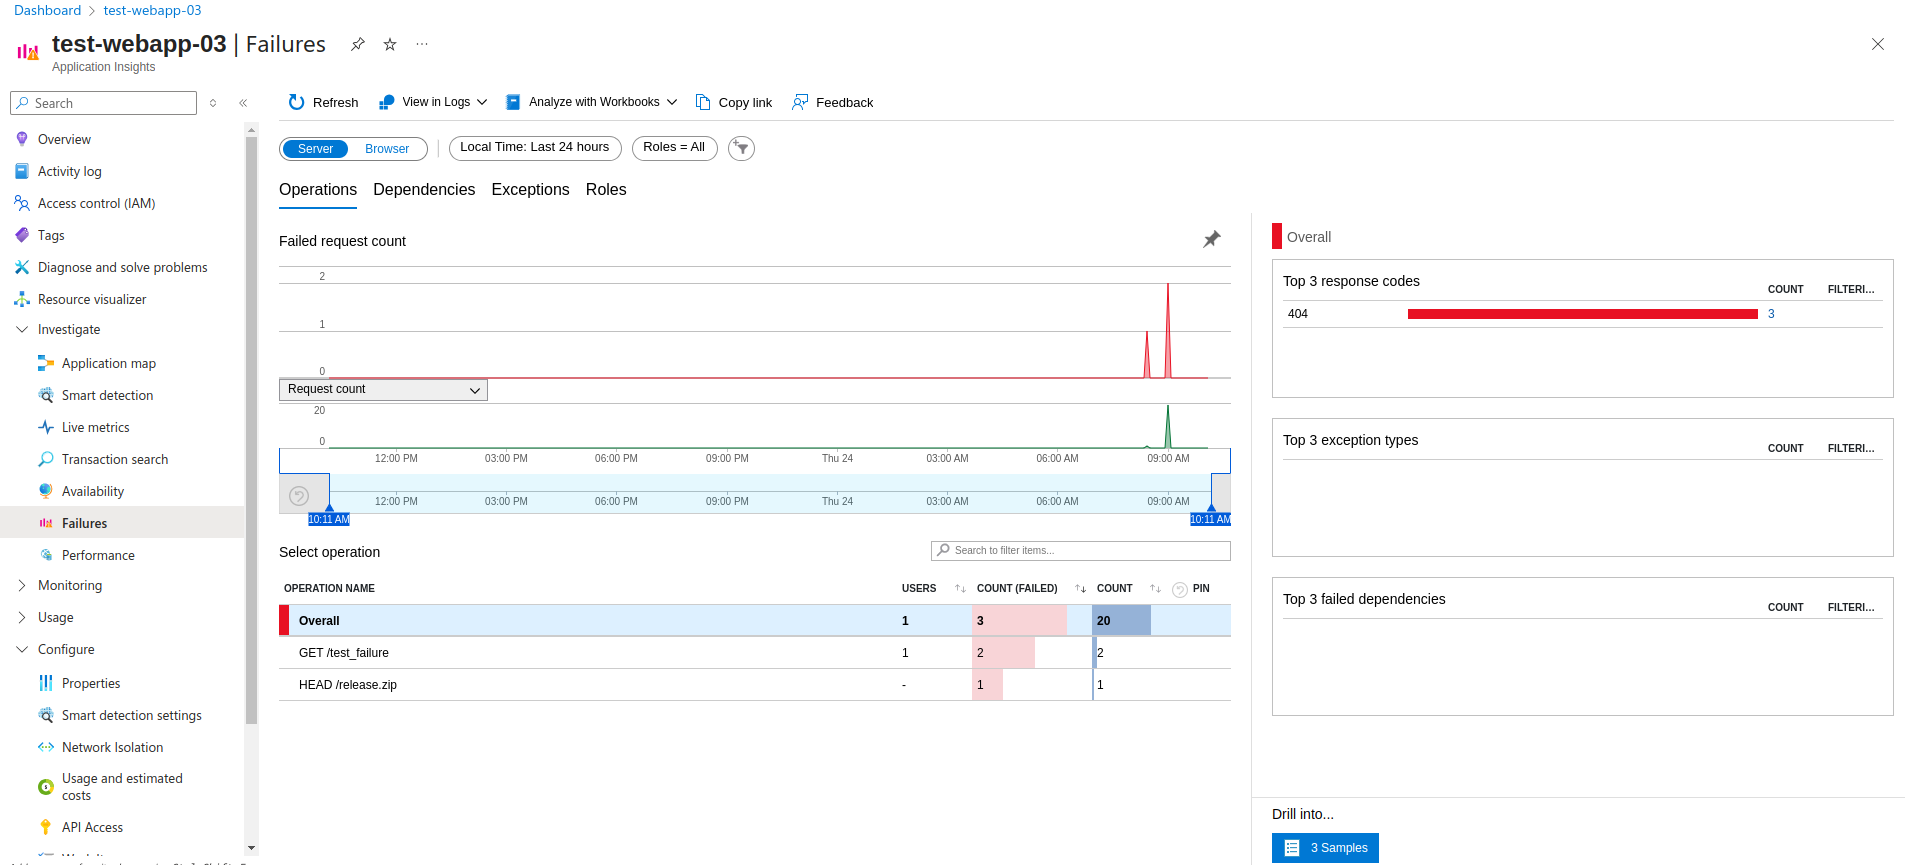
❌ Failures
The Failures blade in Application Insights highlights where and why requests or dependencies are failing. It offers detailed error statistics including exception types, failing endpoints, response codes, and affected users. Developers can easily pivot from high-level summaries to full stack traces and even replay failed requests:
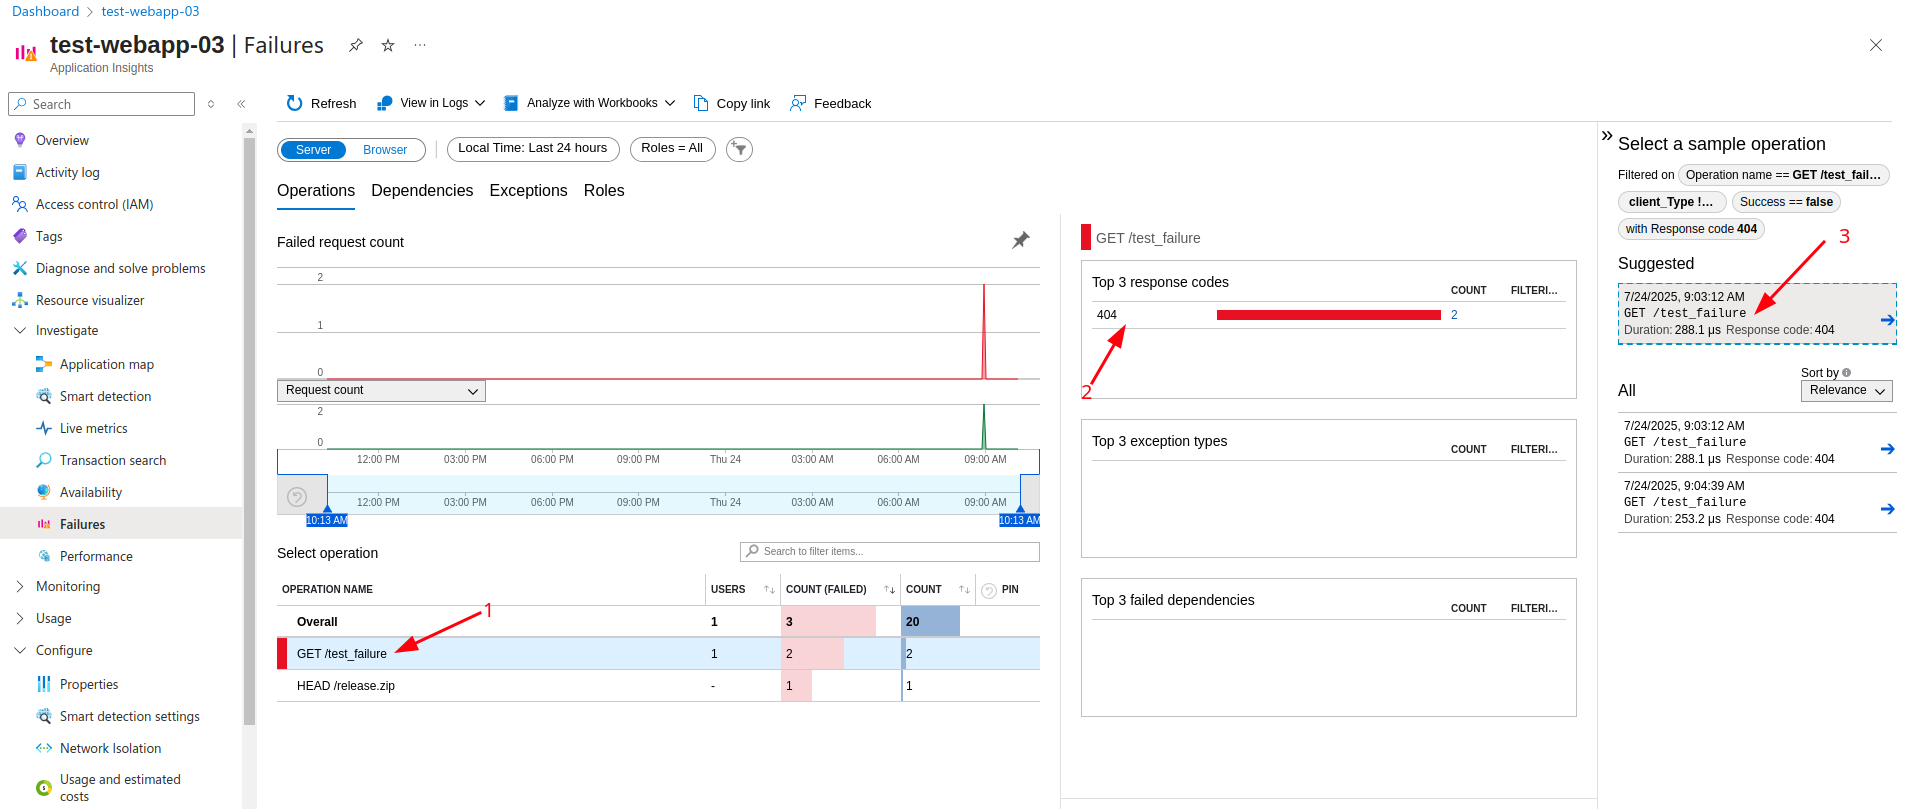
It is possible to go even deeper into the operation details:
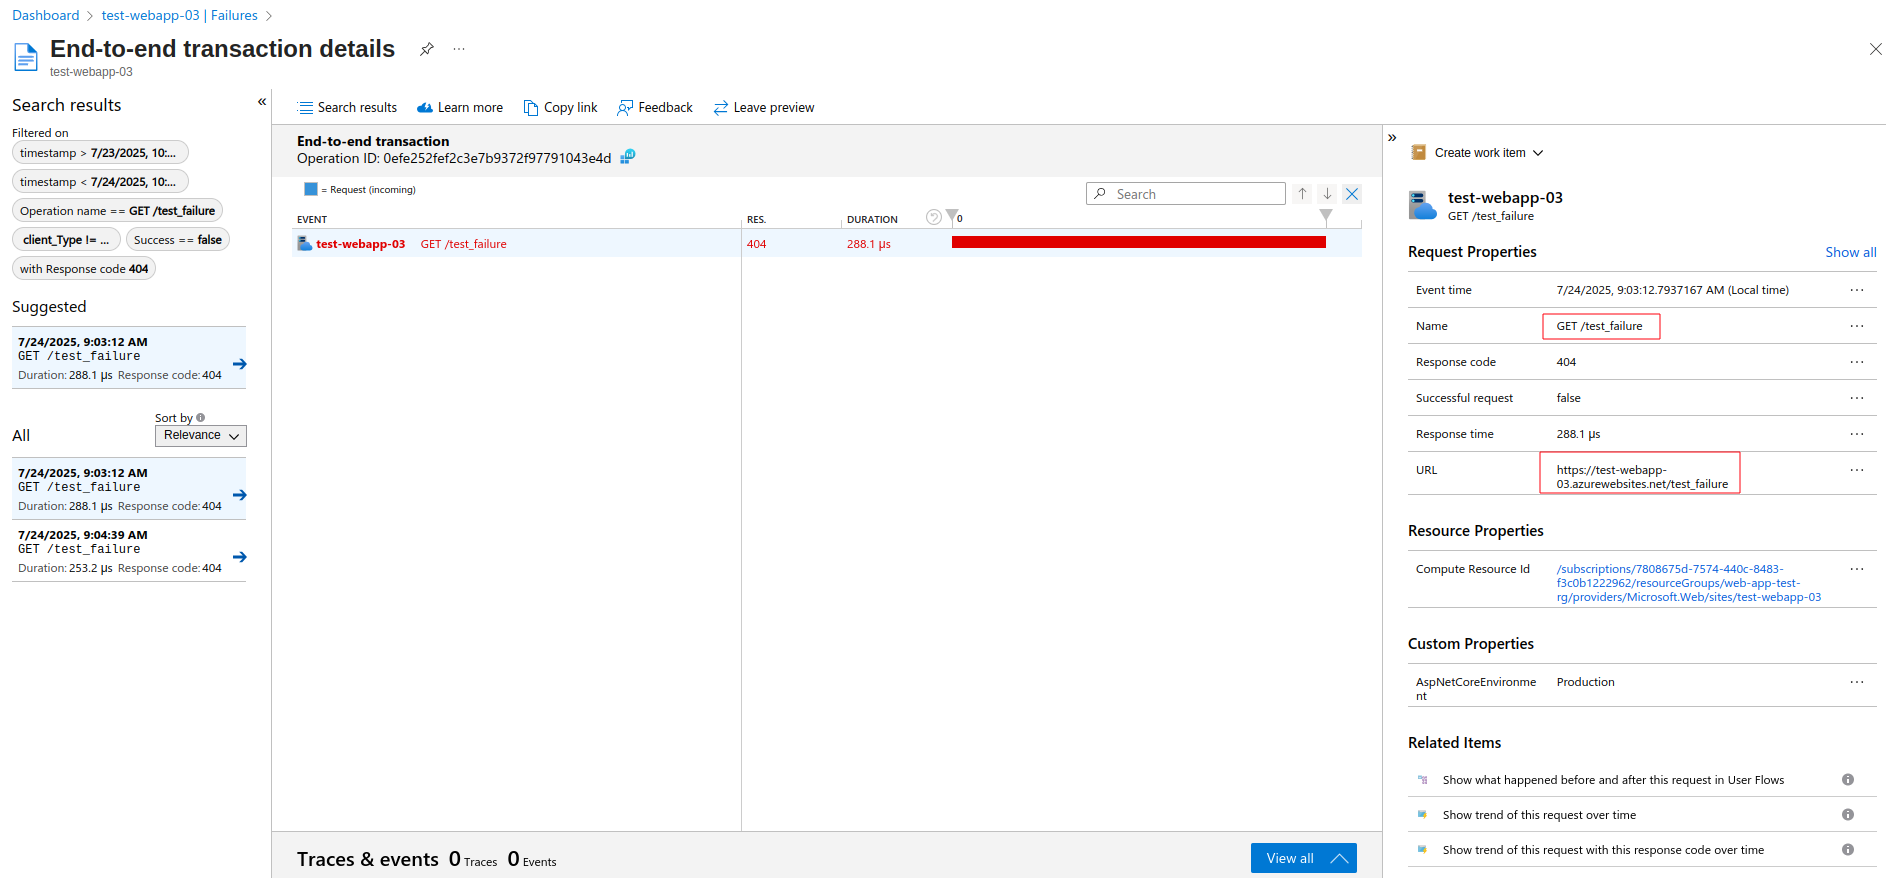
You are then presented with end-to-end transaction details, which include a variety of information:
🔐 Local authentication
Application insights use local authentication by default – only the instrumentation key has to be involved. This poses a security risk due to a possibility of being leaked in source code or by other means. In this tutorial, I used local authentication, but it is a best practice (from both operational and security perspective) to use Entra ID instead – as a centralized place for authentication / authorization. When we think about worst case scenario, if an attacker has access to app insights in Azure portal, he can abuse the resource and use an instrumentation key to send large gygabytes of data, which would result in extra cost for app insights resource. However, by using Entra ID instead, application must use Monitoring Metrics Publisher role alongside with Instrumentation Key to publish telemetry to app insights.
You can use one of the following methods for application insights authentication:
- Managed identity (system or user assigned)
- Service principal
Managed identity is preferred method so that you do not have to manage credentials. To learn more about local authentication in application insights, visit Microsoft documentation or this blog post.
🔧☁️ Deploying app service + app insights with terraform
In this section, I provide the Terraform files by which you can deploy app service alongside application insights. Change the resource names according to your naming convention / practices. This configuration assumes you host your dotnet application in container located in storage account. Therefore do not forget to assign the Shared Access Token (SAS) to the environment variable called WEBSITE_RUN_FROM_PACKAGE.
The APPINSIGHTS_INSTRUMENTATIONKEY and ApplicationInsightsAgent_EXTENSION_VERSION application settings are required to successfully connect the App Service to Application Insights.
variables.tf:
variable "resource_group_location" {
  type        = string
  description = "Location for the resource group."
  default     = "eastus"
}
main.tf:
# Keep the naming conventions
module "naming" {
  source = "Azure/naming/azurerm"
  suffix = ["dev"]
}

# Create resource group
resource "azurerm_resource_group" "webapp_example" {
  location = var.resource_group_location
  name     = "webapp-example-${module.naming.resource_group.name}"
}

# Create linux service plan
resource "azurerm_service_plan" "webapp_example" {
  location            = azurerm_resource_group.webapp_example.location
  name                = "webapp-${module.naming.app_service_plan.name}"
  os_type             = "Linux"
  resource_group_name = azurerm_resource_group.webapp_example.name
  sku_name            = "F1"
}

# Create log analytics for App insights
resource "azurerm_log_analytics_workspace" "webapp_example" {
  location            = azurerm_resource_group.webapp_example.location
  name                = "webapp-example-${module.naming.log_analytics_workspace.name}"
  resource_group_name = azurerm_resource_group.webapp_example.name
  retention_in_days   = 30
  sku                 = "PerGB2018"
}

# Create web app with  application insights
module "avm_res_web_site" {
  source                   = "Azure/avm-res-web-site/azurerm"
  version                  = "0.17.2"
  kind                     = "webapp"
  location                 = azurerm_resource_group.webapp_example.location
  name                     = "webapp-example-${module.naming.app_service.name}"
  os_type                  = azurerm_service_plan.webapp_example.os_type
  resource_group_name      = azurerm_resource_group.webapp_example.name
  service_plan_resource_id = azurerm_service_plan.webapp_example.id
  application_insights = {
    name                  = "webapp-example-${module.naming.application_insights.name}"
    resource_group_name   = azurerm_resource_group.webapp_example.name
    workspace_resource_id = azurerm_log_analytics_workspace.webapp_example.id
  }
  app_settings = {
    WEBSITE_RUN_FROM_PACKAGE = "A shared access signature (SAS) for your code location"
    APPINSIGHTS_INSTRUMENTATIONKEY = "${module.avm_res_web_site.application_insights.instrumentation_key}"
    ApplicationInsightsAgent_EXTENSION_VERSION = "~3"
  }

  site_config = {
    always_on = false
    use_32_bit_worker = true
    application_stack = {
      dotnet = {
        dotnet_version = "9.0"
      }
    }
  }
}
outputs.tf:
output "example_webapp_hostname" {
  value       = module.avm_res_web_site.resource_uri
  description = "The default hostname of the resource."
}
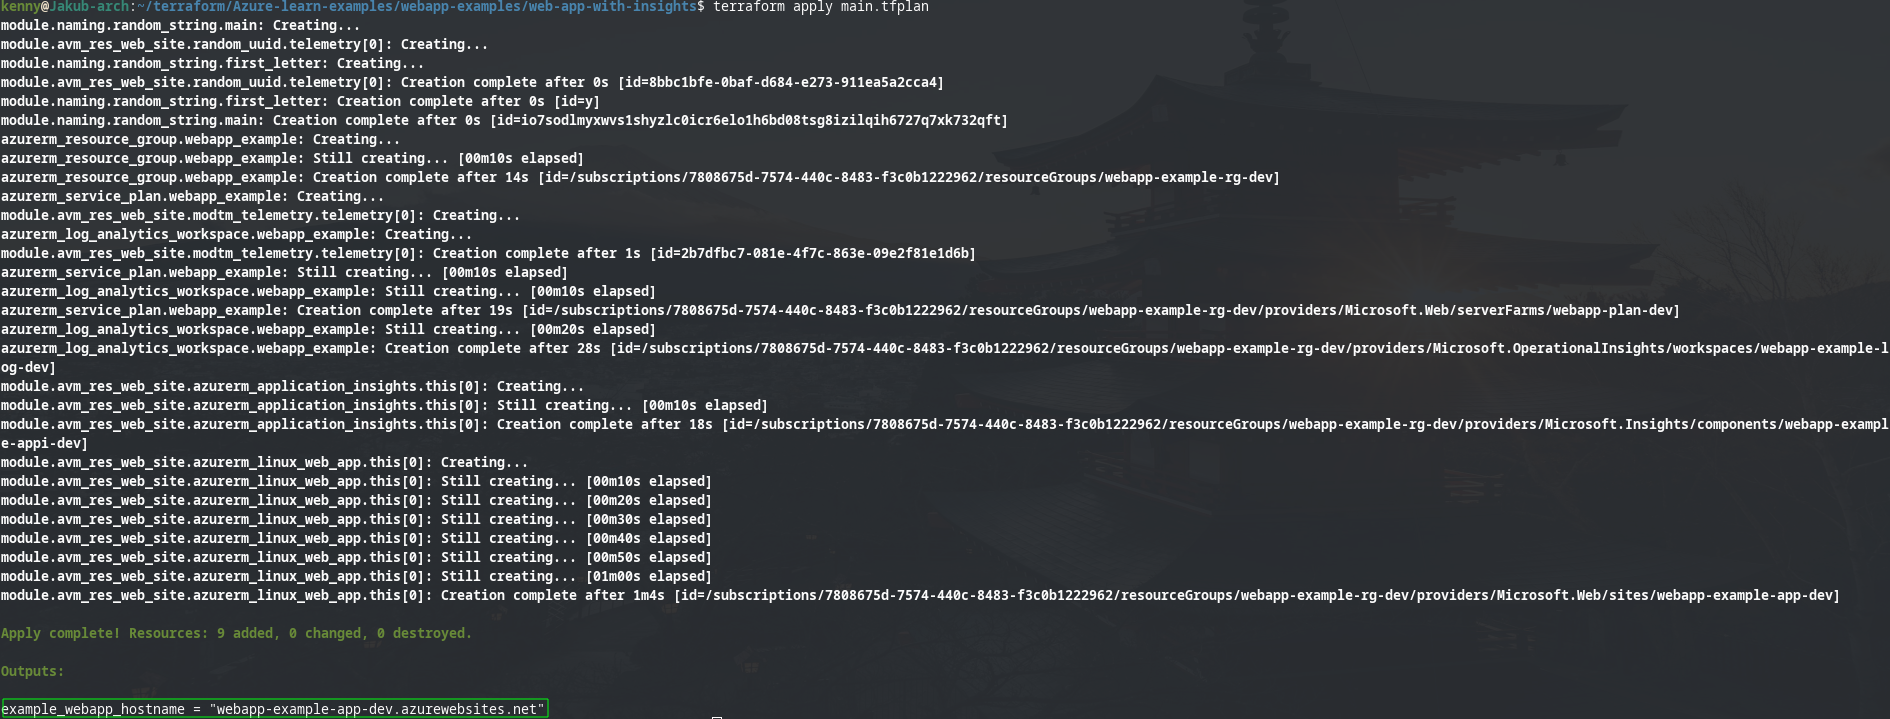
After you generate and subsequently apply the terraform plan, you are presented with url for your app. However, give it a couple of minutes for web app to start and connect to application insights. You might also wait a bit before all components of application insights start working correctly. For example I had to wait about 10 minutes before Transaction Search started showing me the events.
Output from terraform apply main.tfplan command (notice the example_webapp_hostname output containing the generated url for web app):
🧠 Best practices
- ✅ Centralize logs from multiple apps and environmEntra ID for authenticationents in a single workspace
- ✅ Use sampling in production to reduce noise and control costs
- ✅ Track custom business events (like invoice creation, user login) by using app insights SDK
- ✅ Use Entra ID for authentication instead of using just local authentication
📝 Final thoughts
For teams deploying applications in Azure, Application Insights provides a powerful, out-of-the-box monitoring solution tailored for application performance and diagnostics. It delivers immediate feedback on app behavior, request patterns, dependencies, exceptions, and user interactions — all in near real time.
When properly configured, Application Insights enables teams to quickly detect and troubleshoot issues, while also offering long-term visibility into usage trends, performance bottlenecks, and reliability — essential for maintaining high-quality, production-ready applications.